Offsetting Overlapping Labels in d3.js with a Recursive Algorithm, or: using recursion on a real project for the first time eeeee
5 min read
What is recursion? Simply a function that calls itself. As an example, here’s a recursive algorithm for calculating factorials:
function factorial(n) {
    if (n == 2) {
        return 2;
    }
    return n * factorial(n - 1);
}
This is a pretty trivial application; the same alg is easy enough to implement with a simple for loop. But for certain complex operations like merge sort, a recursive approach can be much easier and faster.
To be honest, I never thought I’d use recursion outside of my intro compsci class, at least not directly for my own algorithms. I’ve mainly done front-end development — the complexity of my JS functions rarely went beyond a for loop; if we’re fancy, then maybe some multidimensional arrays and manipulation of them. Recursion didn’t seem like something that was useful for functions that weren’t ridiculously complex or specific.
Recently I’ve been working a lot with d3.js, building a charting library for The Phillipian’s annual State of the Academy project. It’s been an amazing project, learning and getting comfortable with d3.js and Javascript in general, as I’ve only used it tangentially in service of non-JS static content before; this project gives me a good starting point for getting more into JS with tools like React. But I digress. d3.js is relevant because using it requires so much more direct and creative programming. It gives you tons of power by aiding with manipulating data and corresponding elements, but you’re leaving behind the world of document flow and generally built-in layout functionality. Coordinates and dimensions are set directly, so you need to come up with your own algorithms for dealing with overlap and even alignment.
As such, the comfort I gained working with arrays on seemingly arbitrary problems has actually come in handy. One such thing, unexpectedly, was recursion! Let me explain.
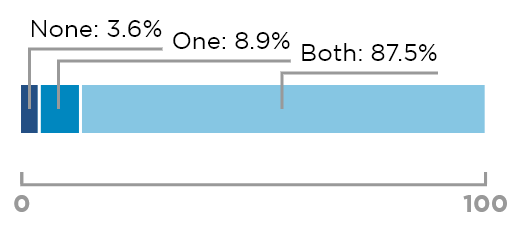
Here’s the starting point. Nice simple stackedBarChart, and I was just starting to implement labels:
The code so far is straightforward. First, I create a polyline, for now with just two points, going from the center of each bar to a certain amount above it. Then, above each of these lines, I render the appropriate text label, and push the right bound of each text label to an array. These right bounds are used to calculate the third point of the polyline, ending right where the text does. (Not sure why it’s not working for “Both” in the example above whoops)
chartGroups.selectAll(".sota-stackedBarChart-label-aboveBar-line")
    .data(d => d)
    .join("polyline")
    .attr("class", "sota-stackedBarChart-label-aboveBar-line")
    .attr("points", d => {
        let x1 = margin.left + x(d[1]) + x(d[0]) / 2;
        let y1 = barHeight / 2;
        let x2 = x1;
        let y2 = -labelBelow;
        return `${x1},${y1} ${x2},${y2}`;
    })
    .attr("stroke-width", separatorStrokeWidth)
    .attr("stroke", lineColor)
    .attr("fill", "none")

let labelRightBounds = [];

chartGroups.selectAll(".sota-stackedBarChart-label-aboveBar-text")
    .data(d => d)
    .join("text")
    .attr("class", "sota-stackedBarChart-label-aboveBar-text")
    .text((d, i) => `${valueLabels[i]}: ${d3.format(".1f")(d[0])}%`)
    .attr("x", d => margin.left + x(d[1]) + x(d[0]) / 2)
    .attr("y", function(d) {
        labelRightBounds.push(d[1] + this.getBBox().x + this.getBBox().width)
        return -2 * labelBelow;
    })
    .attr("alignment-baseline", "bottom")

chartGroups.selectAll(".sota-stackedBarChart-label-aboveBar-line")
    .data(d => d)
    .join("polyline")
    .attr("points", function(d, i) {
        let currentPoints = this.getAttribute("points");
        return currentPoints + ` ${labelRightBounds[i]},${-labelBelow}`;
    })
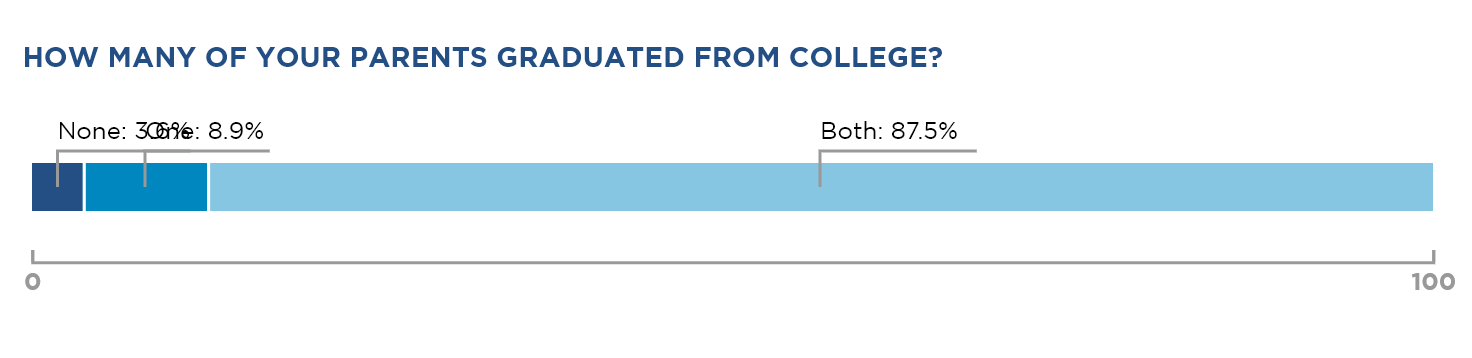
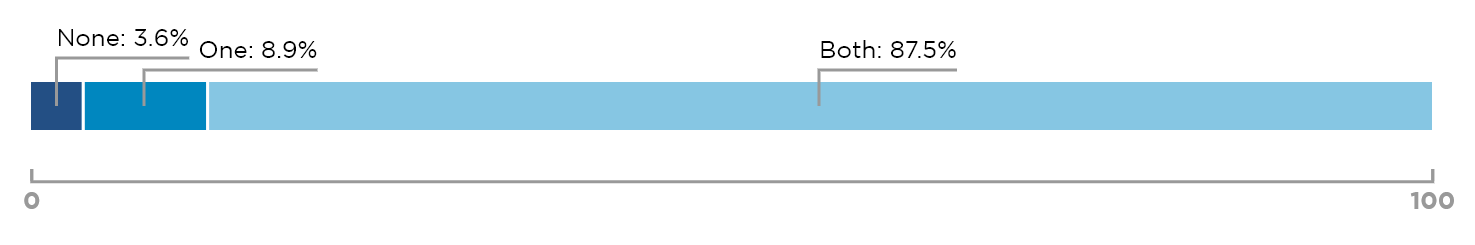
So, okay! Clearly the labels overlapping is a problem. A reference from previous print versions of the survey provide guidance on how to fix this:
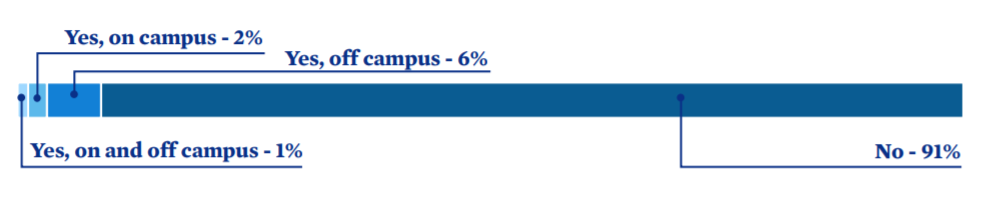
Not the above/below thing — we’ll keep all the labels above for simplicity. But the “Yes, on campus” and “Yes, off campus” labels provide a perfect model for how to offset the labels so they don’t overlap: raise the height of the first overlapping label, and move the second overlapping label right until it no longer overlaps. Time to code it!
Whoops, that’s not right!
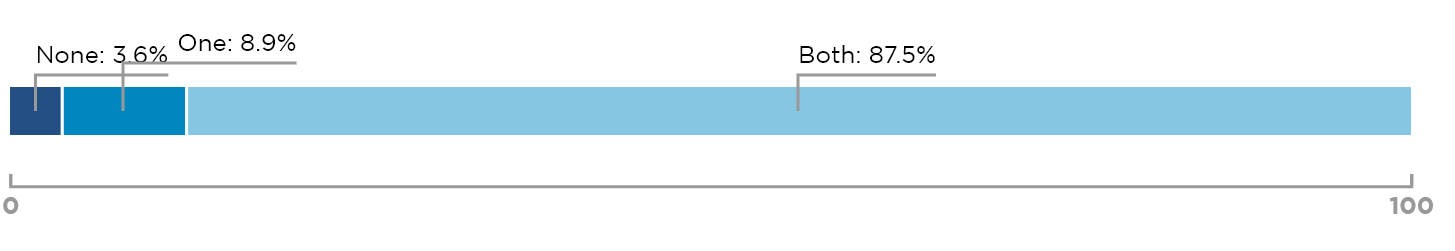
There we go.
This implementation came with a few notable changes from the previous code. I realized that only the text needed to be rendered to calculate the third point of the polyline, and to discover any overlaps, so instead of first creating a polyline with two points and adding the third later, I started by adding the text in their appropriate default spots.
This time, more than the right boundary of each text label is pushed to the labelRightBounds array, but rather an array of both its left boundary position and its width. This allows us to calculate overlap between labels, which I do in a straightforward for loop. Iterating from first to last, if the current element overlapped with the previous one, then I would raise the height of the previous one and extend the left position of the current element.
let labelRightBounds = [];

chartGroups.selectAll(".sota-stackedBarChart-label-aboveBar-text")
    .data(d => d)
    .join("text")
    .attr("class", "sota-stackedBarChart-label-aboveBar-text")
    .text((d, i) => `${valueLabels[i]}: ${d3.format(".1f")(d[0])}%`)
    .attr("x", d => margin.left + x(d[1]) + x(d[0]) / 2)
    .attr("y", function(d) {
        labelRightBounds.push([this.getBBox().x, this.getBBox().width]);
        return -2 * labelBelow;
    })
    .attr("alignment-baseline", "bottom")

let labelHeights = []
let prevRightBound = -labelLeft;

for (let i in labelRightBounds) {
    if (labelRightBounds[i][0] < prevRightBound + labelLeft) {
        labelRightBounds[i][0] = prevRightBound + labelLeft;
        labelHeights[i - 1] -= 1;
        labelHeights.push(-2);
    } else {
        labelHeights.push(-2)
    }
    prevRightBound = labelRightBounds[i][0] + labelRightBounds[i][1]
}

chartGroups.selectAll(".sota-stackedBarChart-label-aboveBar-line")
    .data(d => d)
    .join("polyline")
    .attr("class", "sota-stackedBarChart-label-aboveBar-line")
    .attr("points", (d, i) => {
        let x1 = margin.left + x(d[1]) + x(d[0]) / 2;
        let y1 = barHeight / 2;
        let x2 = x1;
        let y2 = (labelHeights[i] + 1) * labelBelow;
        let x3 = labelRightBounds[i][0] + labelRightBounds[i][1];
        let y3 = y2;
        return `${x1},${y1} ${x2},${y2} ${x3},${y3}`;
    })
    .attr("stroke-width", separatorStrokeWidth)
    .attr("stroke", lineColor)
    .attr("fill", "none")

chartGroups.selectAll(".sota-stackedBarChart-label-aboveBar-text")
    .data(d => d)
    .join("text")
    .attr("x", (d, i) => labelRightBounds[i][0])
    .attr("y", (d, i) => labelHeights[i] * labelBelow);
}
Iterating from front to back is nice because previous right boundary shifts are accounted for; i.e. the shifting of a previous label might cause it to overlap with the next one, which will now have to move more. But thinking about this alg reveals that it doesn’t actually account for not just one, but multiple labels in a row overlapping, because if a label is found to be overlapping with a previous label, only the height of this immediately preceding label is raised. If this preceding label was overlapping with its preceding label, this precending label would not get raised another step, as it should if the second label were raised by the third.
To make the heights work, you’d have to iterate from last to first label, raising each one a successive step higher if necessary; but then you wouldn’t be able to account for rightward shifts causing overlap, which propagate from first to last label. To solve this problem we’d have to iterate both forwards and backwards.
One solution is to do just that — loop over everything twice: once first-to-last to apply rightward shifts, and again last-to-first to apply height shifts. But before I could get to that, a different idea took hold. Recursion!
Let’s take a look at the final implementation — just the recursive part replacing the for loop, as the rendering code didn’t really change.
function getLabelHeight(i) {
    if (i == labelRightBounds.length - 1) {
        labelHeights[i] = -2;
        return -2;
    } else if (labelRightBounds[i][0] + labelRightBounds[i][1] + labelLeft > labelRightBounds[i + 1][0]) {
        labelRightBounds[i + 1][0] = labelRightBounds[i][0] + labelRightBounds[i][1] + labelLeft;
        let nextHeight = getLabelHeight(i + 1);
        let thisHeight = nextHeight - 1;
        labelHeights[i] = thisHeight;
        return thisHeight;
    } else {
        getLabelHeight(i + 1);
        labelHeights[i] = -2;
        return -2;
    }
}

getLabelHeight(0);
We still have our labelHeights and labelRightBounds arrays, the latter storing the left coordinate and width of each label. We define our recursive function function getLabelHeight with parameter i, the index of the current label in consideration.
Our first conditional checks for the base case: if the label in consideration is the last label. In this case, we set the corresponding labelHeights slot to the default height, and return it (or at least the coefficient of it; -2 in this case because the line is -1 units up, and the text -2. This coefficient increments by one from here on out).
If this isn’t the case, then the next label exists, and the current label either overlaps with it or not. If it doesn’t overlap, then easy, we set the corresponding labelHeights slot to the default value and return it. Before we do that, we call labelHeights(i+1) so the next labelHeight is calculated.
If it does overlap, or is closer than a specified margin, then we must raise the height of the current label. What do we raise the current label to? To one step higher than the height of the next label. But we don’t know the height of the next label, do we? Let’s find it, by calling the very function getLabelHeight on it, passing in i+1 as the parameter; then we can set the return value of the function as the corresponding labelHeights slot, and return this value for the preceding function call. In the case that the next label is raised because it overlaps with the label after that, it will return a raised height, and the height of the current label will be raised to the appropriate height above that. This applies for however many overlapping labels you have; they might clip out of the SVG Canvas, but the heights will cascade all the way from either the first non-overlapping label or the last one back, forming a nice staircase of heights.
Sounds good. Does it actually work?
Okay, nothing changed, but that was what was supposed to happen. That means that the function works for a two-overlap scenario. Let’s shrink down our window to see the cascade in action:
Hell yeah, there we go!
The recursive function ended up being 16 lines of code, compared to the single loop’s 9; implementing the second backwards loop for the same functionality as the recursive function probably would have at least doubled the line count, so the recursive function is certainly nicer to write, and arguably understand, than a double loop. Is it faster to run? I have no idea. In effect it’s looping over the data the same way: once forward, each function call calling the function on the next label before it returns, up until the last label; and then once backward, each function return propagating to the previous function call for the last operations before turning to the next previous call, all the way up to the first call which returns the value to nothing.
None of this was particularly mind-blowing, but it brought me a lot of joy to use what I had learned forever ago in a classroom on a real project, a neat trick that solved a real, somewhat tricky problem.
Contact me
Have a question about my work? Want to work together? Don't hesitate to reach out!
Email me at hello@samsonzhang.com, or message me on Twitter @wwsalmon.